
Part:BBa_K2152004:Experience
This experience page is provided so that any user may enter their experience using this part.
Please enter
how you used this part and how it worked out.
Characterizations of BBa_K2152004
The ShanghaiTech_China 2019 monitored the OD600 of BL21 every 1 hour for 6 hours after addition of IPTG and the final results are shown in the graph below. In the graph, the blue lines show the OD600 of the control groups and the pink ones show the experiment groups. The deeper the color, the higher the concentration of IPTG. The lightest pink is an experiment group with no IPTG. We can see that although higher IPTG concentrations reduce the growth rate when compared to IPTG = 0 group, geneE expression has an obvious killing effect on the experiment groups as the OD600 decreases in 6 hours.
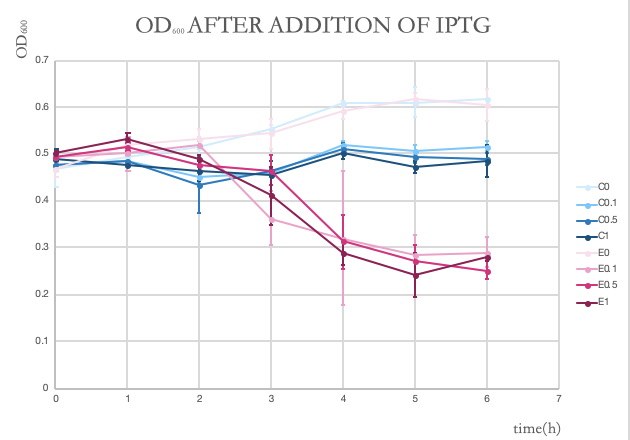
This graph shows the OD600 changes after addition of IPTG in six hours. Pink lines stand for experiment groups (with GeneE) and blue ones stand for control groups (without GeneE). Different numbers stand for different concentrations of IPTG: C0 - control group with no IPTG; C0.1 - control group with IPTG of 0.1mM; C0.5 - control group with IPTG of 0.5mM; C1 - control group with IPTG of 1.0mM; E0 - experiment group with no IPTG; E0.1 - experiment group with IPTG of 0.1mM; E0.5 - experiment group with IPTG of 0.5mM; E1 - experiment group with IPTG of 1.0mM.
Applications of BBa_K2152004
ShanghaiTech_China 2019 utilized this part as a kill switch for bio-safety of their project.(https://2019.igem.org/Team:ShanghaiTech_China/Safety)
User Reviews
UNIQa339e59da97833b5-partinfo-00000000-QINU